Three Core Principles

Detect early

We identify sub-visible spectral signatures of plant stress 5-10 days before symptoms become visible to the human eye, shifting farm management from reactive to proactive.

Act precisely

Generate georeferenced prescription maps that target only affected zones, plugging directly into variable-rate sprayers to save inputs and reduce environmental load.

Decide with data

Fused multispectral imagery, ground sensors, micro-weather, and historical yield data in one unified mobile dashboard for confident agronomic planning.
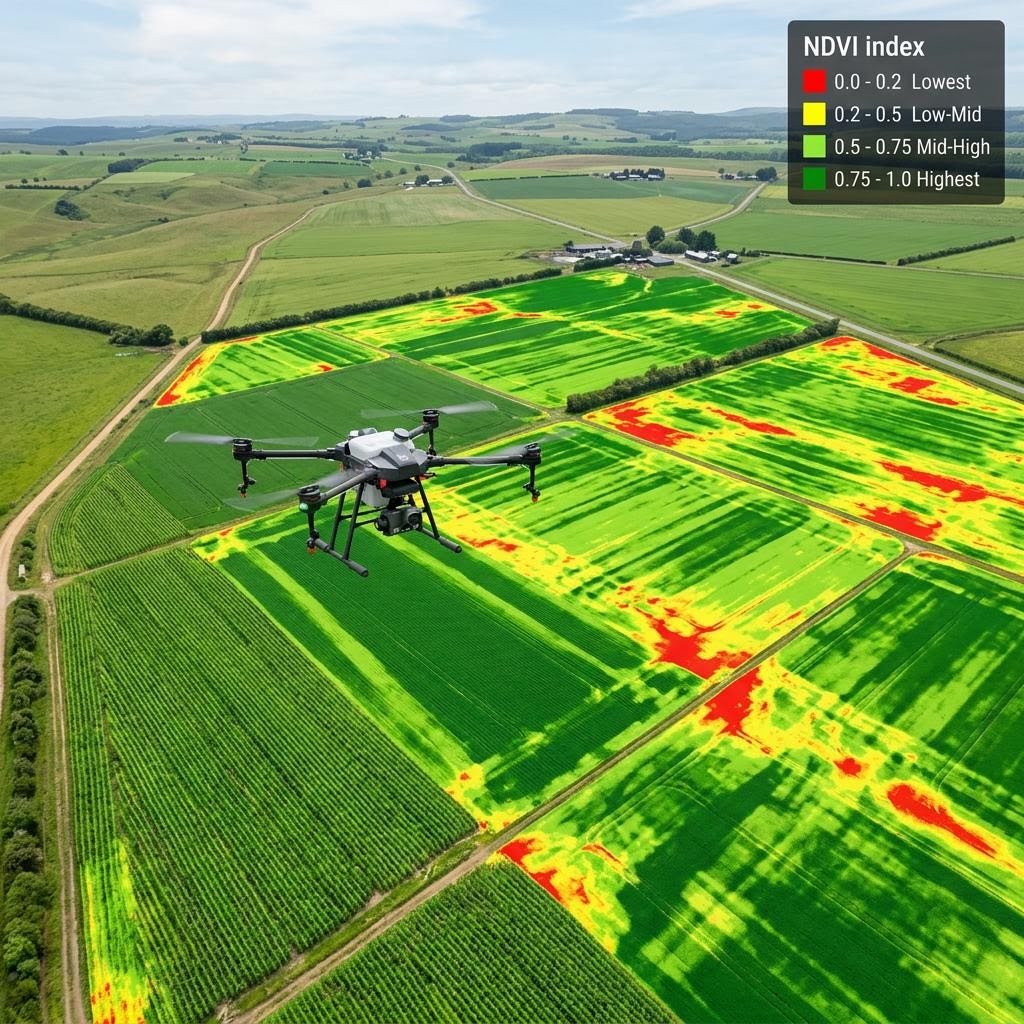
Agricultural drone mapping field

System Architecture Overview

TerraMind AI is organized into four layers. Data flows continuously from field to farmer, with critical alerts short-circuiting through the edge layer for near-real-time response.

Layer 1 — Data Acquisition

  • Fixed-wing or multirotor drones with RGB, multispectral (NDVI/NDRE), and thermal cameras, flown every 3-7 days or on-demand.
  • Ground-based IoT sensor nodes measuring soil moisture, soil temperature, leaf wetness, and micro-climate.
  • Optional fixed smart cameras at field edges for continuous low-cost monitoring between drone flights.
  • Satellite imagery as a low-cost supplementary layer for large-area trend tracking.

Layer 2 — Edge & Cloud AI Processing

  • Edge inference module runs a lightweight CNN for first-pass anomaly flagging, enabling same-flight alerts.
  • Cloud-based deep learning models perform detailed disease classification, severity scoring, and pixel-level lesion mapping.
  • Time-series forecasting model fuses imagery indices with weather data to predict yield and disease-spread trajectory.
  • Recommendation engine translates detections into agronomic prescription maps.

Layer 3 — Decision Support

  • Severity and confidence scoring per zone, with priority ranking.
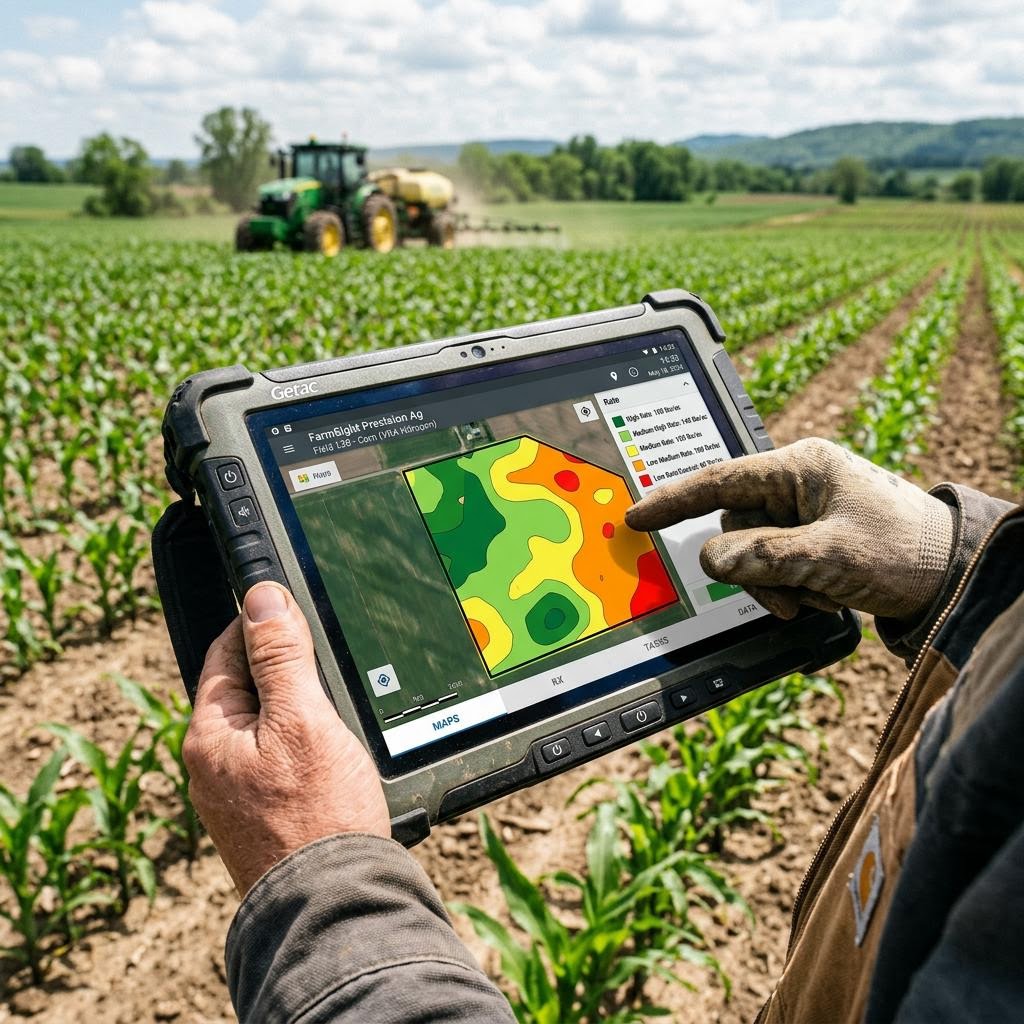
  • Treatment prescription maps compatible with variable-rate sprayers and irrigation controllers.
  • Yield forecast dashboard with confidence intervals.
  • Historical trend and benchmark views comparing current-season health to prior seasons.

Layer 4 — Delivery

  • Mobile app (iOS/Android) with offline-capable field maps and photo verification workflow.
  • Web dashboard for farm managers overseen multiple fields.
  • API integrations with existing farm management software and insurance/lending platforms.
Tablet showing prescription map

Implementation Roadmap

Phase 1: Baseline Mapping

Initial drone flight to create high-res base map and define field boundaries.

Phase 2: Sensor Deployment

Install IoT soil and weather sensors in representative field zones.

Phase 3: System Calibration

AI models calibrate to local crop varieties and historical yield data.

Phase 4: Routine Monitoring

Establish 3-7 day drone flight schedule and activate real-time edge processing.

Phase 5: First Intervention

System flags anomaly, generates variable-rate prescription, farm executes.

Phase 6: Yield Modeling

Continuous forecast updates based on intervention success until harvest.

Return on Investment

Setup Cost Moderate (One-time)
Software Platform Low recurring per-hectare
Input Cost Savings 20-25% reduction
Yield Improvement 15-30% retention
Payback Period 12-18 months
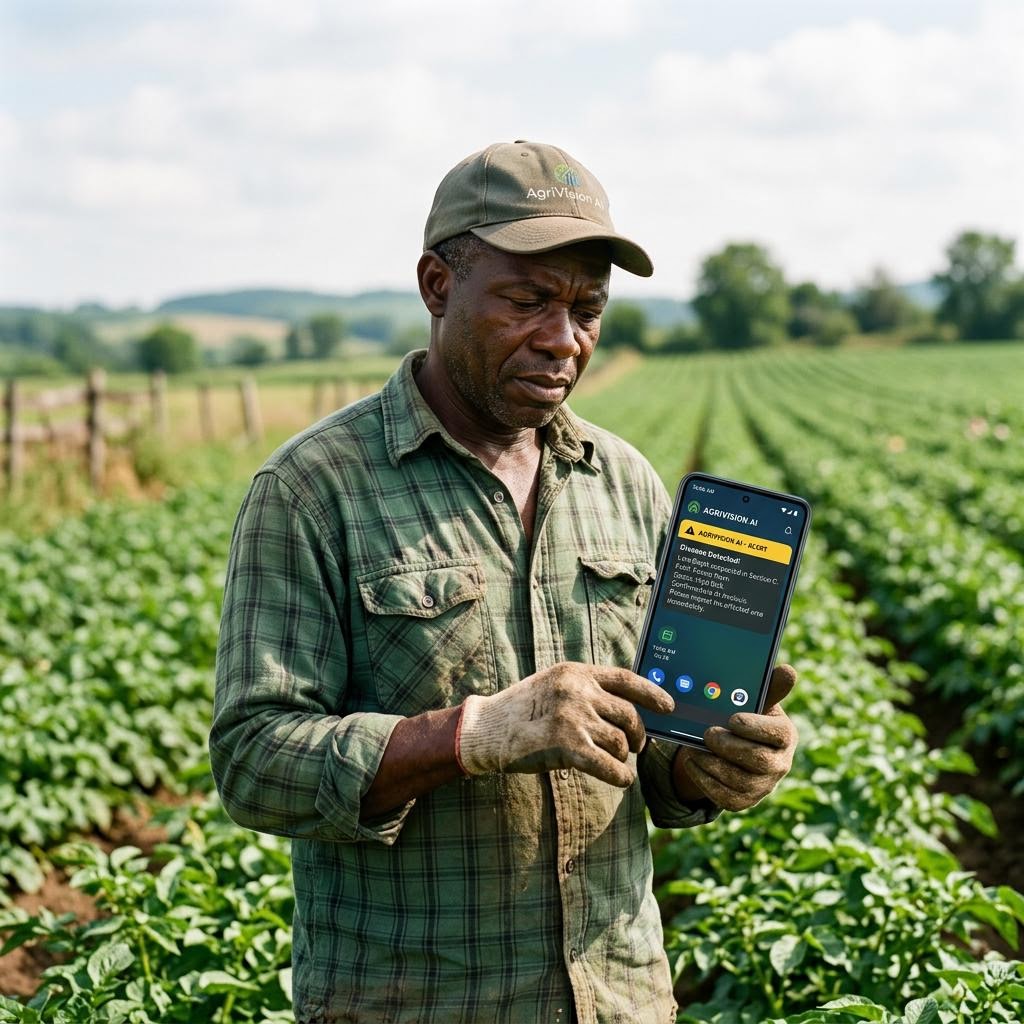
Farmer receiving alert

Curious about the models under the hood?

Explore the AI architecture that makes early detection possible.

See the Technology →